
New projections reveal 33 suburbs across the Geelong region would have $1m median home prices by 2036.
New home price modelling highlights the chilling reality young homebuyers face trying to break into the property market if issues tackling new housing supply in the region aren’t tackled.
The exclusive PropTrack analysis shows the five-year compounding annual rate of median home values could see a typical house in Geelong’s cheapest suburbs hit more than $660,000 by 2031, while seven additional suburbs would jump above $1m, including Highton, Geelong West and Waurn Ponds.
The modelling shows 33 of the regions suburbs could have $1m-plus median house values by 2036.
RELATED: Old church conversion part of a grander plan
Sellers pocket $200k bonus in Torquay sale
Geelong’s rising stars lose their property shine
The analysis applies the past five and 10-year market performance to housing markets across the next periods, revealing a five-year compound annual growth rate of between 2.17 per cent to more than 5 per cent, creating the dramatic rise across affordable areas such as Norlane, Corio and Bell Park, and favourite family suburbs including Herne Hill, Geelong West and Highton.
While the Geelong region was riding a high wave of demand for housing amid the last pandemic lockdowns in 2021, a subsequent market-wide correction and a sharp rise in interest rates brings a dose of reality to the data.
The post-pandemic period has been fairly soft for Geelong and Melbourne housing markets, realestate.com.au senior economist Angus Moore said.

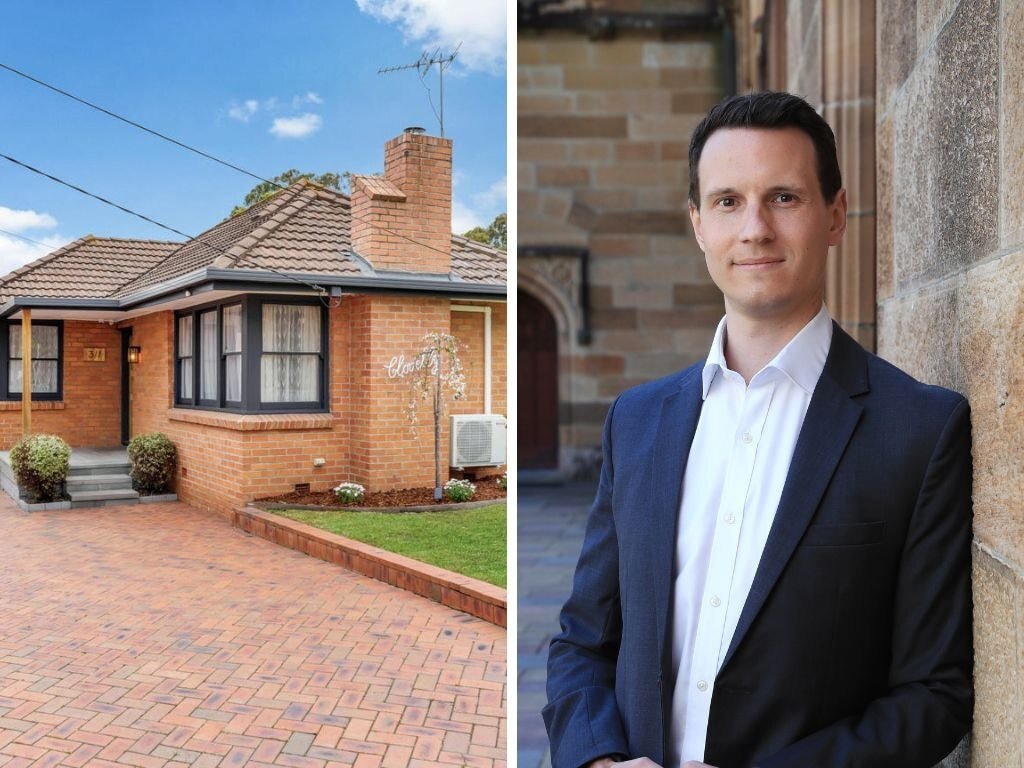
Realestate.com.au senior economist Angus Moore.
“Victoria broadly has underperformed much of the rest of Australia, and means it now looks quite affordable – not in absolute terms with interest rates where they are – but relative to elsewhere in the country,” he said.
Mr Moore said the Geelong region’s strong population growth and position as a lifestyle area commutable to Melbourne were key drivers of price growth.
“The fundamentals that drive housing demand come back to population growth, incomes or economic growth, and how many homes we build,” Mr Moore said.
311 Church St, Herne Hill, is listed for sale with price hopes from $779,000 to $839,000. The suburb is tipped to reach a $1m median price by 2031.
“The post-pandemic period has seen a permanent shift in demand towards areas like Geelong that are commutable to the city.
“Even if you’re only working one or two (days in the office), that can become a much more attractive trade-off than was true 10 years ago.”
The strong demand highlights the growing price pain points for homebuyers as economic factors restrict the supply of new housing in the region, Mr Moore said.
“The only way that housing in Australia can become more affordable than it is today – or indeed not get substantially less affordable – is if we build more housing in the places that people want to live and where housing demand is,” Mr Moore said.
The three-bedroom house at 29 Clarence St, Geelong West, is listed for sale with price hopes from $975,000 to $1.025m. The suburb is tipped to reach a $1m median price by 2031.
He said challenging housing affordability creating strong growth in affordable areas because that’s where most demand was being pushed.
Geelong buyers advocate Tony Slack said affordability was becoming an even bigger issue in the housing market given rising interest rates, but also as a result of the region’s ageing population.
“It’s supply and demand,” Mr Slack said. If we’re not building enough homes relative to the amount of people looking for homes, it’s going to be greater demand with supply decreasing for that very reason, which then helps maintain the price status,” Mr Slack said.
The four-bedroom house at 11 Rathmines Place, Highton, is listed for sale with price hopes from $890,000 to $960,000. The suburb is tipped to reach a $1m median price by 2031.
Mr Slack said a big transfer of property between long-term investors and new investors had seen home prices spike.
“Affordability has driven those markets, record low interest rates. But it hasn’t really been a supply-demand conversation,” Mr Slack said.
“There’s been a lot of investors where the timing was absolutely perfect for those people who owned those homes for a significantly long period of time and saw it as a great opportunity to cash out.”
WHAT YOUR HOME COULD BE WORTH IN 2031
Suburb |
Type |
Median value Sept 2026 |
5-year projection |
5-year compound annual growth rate |
10-year projection |
10-year compound annual growth rate |
| Anglesea | H | $1.29m | $1.47m | 2.67% | $2.02m | 4.58% |
| Bannockburn | H | $787,000 | $1.1m | 5.18% | $1.29m | 5.08% |
| Barwon Heads | H | $1.44m | $1.68m | 3.14% | $2.28m | 4.70% |
| Bell Park | H | $680,000 | $853,463 | 4.65% | $1.06m | 4.55% |
| Bell Park | U | $552,000 | $651,859 | 3.38% | $788,038 | 3.62% |
| Bell Post Hill | H | $703,000 | $875,449 | 4.49% | $1.08m | 4.41% |
| Belmont | H | $739,000 | $910,429 | 4.26% | $1.1m | 4.06% |
| Belmont | U | $542,000 | $647,600 | 3.62% | $795,002 | 3.91% |
| Breakwater | H | $574,000 | $664,789 | 2.98% | $891,911 | 4.51% |
| Clifton Springs | H | $685,000 | $832,488 | 3.98% | $1m | 3.88% |
| Corio | H | $579,000 | $740,439 | 5.04% | $951,594 | 5.09% |
| Corio | U | $433,000 | $515,310 | 3.54% | $630,045 | 3.82% |
| Drysdale | H | $748,000 | $917,849 | 4.18% | $1.1m | 4.02% |
| Drysdale | U | $562,000 | $600,779 | 1.34% | $733,653 | 2.70% |
| East Geelong | H | $790,000 | $918,192 | 3.05% | $1.24m | 4.66% |
| East Geelong | U | $518,000 | $612,288 | 3.40% | $737,467 | 3.60% |
| Geelong | H | $849,000 | $974,150 | 2.79% | $1.3m | 4.40% |
| Geelong | U | $564,000 | $664,477 | 3.33% | $800,149 | 3.56% |
| Geelong West | H | $821,000 | $1.04m | 4.88% | $1.28m | 4.60% |
| Geelong West | U | $529,000 | $591,708 | 2.27% | $746,656 | 3.51% |
| Grovedale | H | $729,000 | $880,729 | 3.85% | $1.05m | 3.75% |
| Grovedale | U | $529,000 | $634,155 | 3.69% | $781,704 | 3.98% |
| Hamlyn Heights | H | $731,000 | $919,794 | 4.70% | $1.13m | 4.48% |
| Hamlyn Heights | U | $570,000 | $657,316 | 2.89% | $764,918 | 2.99% |
| Herne Hill | H | $723,000 | $919,024 | 4.92% | $1.14m | 4.70% |
| Herne Hill | U | $380,000 | $439,259 | 2.94% | $511,411 | 3.01% |
| Highton | H | $896,000 | $1.1m | 4.25% | $1.34m | 4.14% |
| Highton | U | $537,000 | $631,060 | 3.28% | $753,534 | 3.45% |
| Indented Head | H | $750,000 | $919,480 | 4.16% | $1.11m | 4.04% |
| Jan Juc | H | $1.34m | $1.6m | 3.70% | $2.24m | 5.28% |
| Lara | H | $731,000 | $889,506 | 4.00% | $1.07m | 3.94% |
| Lara | U | $515,000 | $602,678 | 3.19% | $723,415 | 3.46% |
| Leopold | H | $726,000 | $884,023 | 4.02% | $1.07m | 3.98% |
| Leopold | U | $537,000 | $631,159 | 3.28% | $757,488 | 3.50% |
| Lorne | H | $1.61m | $1.8m | 2.17% | $2.34m | 3.85% |
| Lorne | U | $1m | $1.04m | 0.85% | $1.23m | 2.09% |
| Lovely Banks | H | $793,000 | $1.02m | 5.24% | $1.33m | 5.31% |
| Manifold Heights | H | $900,000 | $1.15m | 5.03% | $1.43m | 4.80% |
| Manifold Heights | U | $495,000 | $570,527 | 2.88% | $661,159 | 2.94% |
| Marshall | H | $675,000 | $771,395 | 2.71% | $985,473 | 3.86% |
| Newcomb | H | $631,000 | $786,371 | 4.50% | $971,489 | 4.41% |
| Newcomb | U | $504,000 | $602,292 | 3.63% | $738,764 | 3.90% |
| Newtown | H | $1.14m | $1.42m | 4.50% | $1.73m | 4.26% |
| Newtown | U | $573,000 | $678,249 | 3.43% | $819,959 | 3.65% |
| Norlane | H | $531,000 | $690,160 | 5.38% | $895,401 | 5.36% |
| Norlane | U | $455,000 | $550,332 | 3.88% | $687,178 | 4.21% |
| North Geelong | H | $667,000 | $840,296 | 4.73% | $1.05m | 4.64% |
| Ocean Grove | H | $932,000 | $1.1m | 3.42% | $1.5m | 4.91% |
| Ocean Grove | U | $717,000 | $754,816 | 1.03% | $912,836 | 2.44% |
| Point Lonsdale | H | $1.14m | $1.29m | 2.43% | $1.67m | 3.88% |
| Point Lonsdale | U | $759,000 | $800,687 | 1.08% | $965,898 | 2.44% |
| Portarlington | H | $812,000 | $993,913 | 4.13% | $1.2m | 4.00% |
| Portarlington | U | $618,000 | $651,273 | 1.05% | $783,863 | 2.41% |
| Queenscliff | H | $1.25m | $1.41m | 2.35% | $1.82m | 3.79% |
| St Albans Park | H | $666,000 | $812,511 | 4.06% | $985,157 | 3.99% |
| St Albans Park | U | $490,000 | $587,864 | 3.71% | $725,240 | 4.00% |
| St Leonards | H | $707,000 | $867,826 | 4.18% | $1.05m | 4.07% |
| St Leonards | U | $564,000 | $595,526 | 1.09% | $719,719 | 2.47% |
| Thomson | H | $577,000 | $665,208 | 2.89% | $892,047 | 4.45% |
| Torquay | H | $1.17m | $1.38m | 3.31% | $1.89m | 4.86% |
| Torquay | U | $854,000 | $918,947 | 1.48% | $1.12m | 2.80% |
| Wandana Heights | H | $1.03m | $1.27m | 4.24% | $1.55m | 4.15% |
| Waurn Ponds | H | $825,000 | $1m | 3.96% | $1.19m | 3.81% |
| Whittington | H | $579,000 | $706,849 | 4.07% | $855,486 | 3.98% |
| Whittington | U | $435,000 | $525,918 | 3.87% | $656,778 | 4.21% |
| Winchelsea | H | $654,000 | $844,229 | 5.24% | $1.07m | 5.13% |
Source: PropTrack