
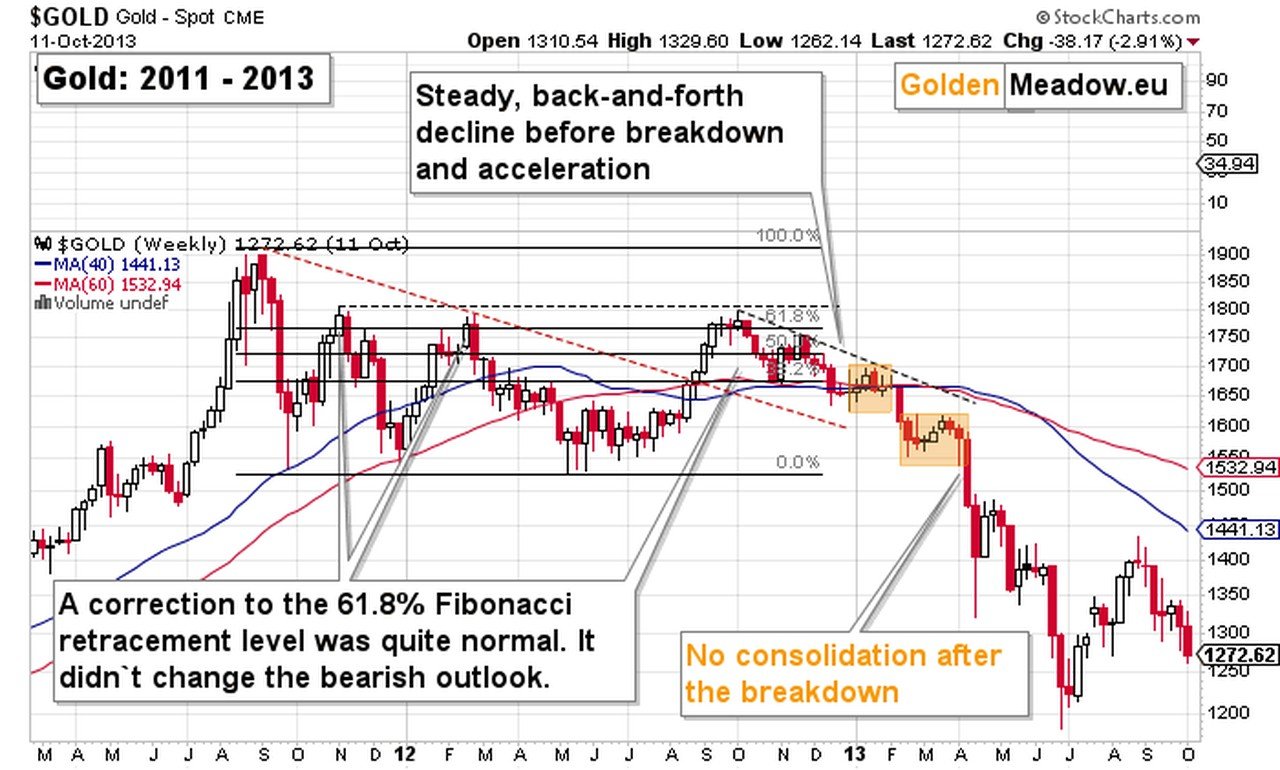
Gold fell to a new 2026 low on Thursday, breaking below the October low from which its final rebound started, just as it did before the April 2013 crash.
Investorideas.com (www.investorideas.com), a go-to platform for big investing ideas, features a gold price analysis article from Przemyslaw K. Radomski, CFA.
At the moment of writing these words, December gold futures trade near $3,900, after an overnight move up to $3,927.20. On Thursday, they fell $115.20 to $3,885.30, and their intraday low of $3,856.70 took them below the October 30 low of $3,879.30. It was a new 2026 low and gold’s lowest level since early October 2025. Gold broke below the support level from which its final rebound started.
On September 1, when gold traded near $4,426, I wrote that “the following months are still likely to repeat what we saw in late 2012 and 2013 before that bull market resumes.” Since then, gold has declined by about 12 percent.
On Tuesday, a day after the rebound’s top at $4,157.70, I wrote: “The current rebound seems to be the final one, similar to the rebound of February and March 2013, which came right before gold’s April 2013 crash.” Thursday’s break below the October low confirmed it.
This matters because of what happened after the same kind of break in 2013.
Advertisement
The Break That Came Before the 2013 Crash
In 2013, the final rebound took gold from its February 21 low of $1,555.06 to $1,616.47 on March 21. On April 3, gold moved below the February low, and on April 4, it closed below it.
Then gold rebounded for three sessions, to a close of $1,585.25 on April 9. The crash started three sessions later: gold fell 5.1 percent on April 12 and 9.1 percent on April 15, and it bottomed at $1,321.54 on April 16.
The table below puts 2013 and 2026 side by side.
This year’s version of the pattern is moving faster.
The 2026 Version Moves Faster
This year, the final rebound took gold from its October 30 low to $4,157.70 on November 9, and on Thursday, gold moved below the October low. In 2013, gold needed 13 days after the rebound’s top to break below its pre-rebound low. This year, it needed only 3 days.

This morning’s upswing doesn’t change the picture. In 2013, gold rebounded for three sessions after the break, and then the crash started. In my view, today’s move up is a verification of the breakdown to new 2026 lows, and it’s in tune with what happened in 2013.
Even today’s slightly cooler PPI report didn’t trigger a rally. Producer prices rose 0.3 percent in October, while economists polled by Dow Jones expected 0.4 percent, and gold is still below its overnight high.
Gold’s weakness comes from rates and the dollar.
Rates Matter More Than War Headlines
Thursday’s decline came from the price of money. Crude oil rallied, the 10-year Treasury yield rose 12 basis points to 5.10 percent, and the USD Index futures closed at 103.094, their highest close of 2026. At Thursday’s close, the fed funds futures priced more than one full rate hike for the December 8-9 meeting, and San Francisco Fed President Mary Daly said: “My bias is that further tightening will be needed.”
A Fed tightening cycle is bearish for gold. Higher bond yields make gold, which pays no interest, less attractive, and they support the dollar.
The war news didn’t help gold at all. Iran’s military said that four oil tankers were hit by explosions in the Strait of Hormuz, and President Trump wrote: “We don’t need a deal with Iran.” Gold declined anyway. Events in Iran
affect gold mostly through oil, and gold reacts to rates and the dollar much more than to the risk of a new war in the Middle East. When gold fails to rally on news that should help it, it’s bearish information.
Where This Leaves Us
Gold broke below its October low, which ended its final rebound. In 2013, a short rebound followed a similar break, and the crash came days later. In my view, gold’s next big move is likely to be down, toward about $3,500, the next target that I described in my November 2026 forecast. In today’s Gold Trading Alert, I also covered the USD Index’s next upside targets, the mining stocks, and copper’s warning for the stock market.
In 2013, the crash came about a week after a break like Thursday’s.
Important note: the forecasts are up-to-date at the moment of their publication, we don’t guarantee updating them for free readers. We will, however, keep our premium subscribers updated at all times.
Thank you for reading today’s analysis – I appreciate that you took the time to dig deeper and that you read the entire piece. If you’d like to get more (and extra details not available to 99% investors), I invite you to stay updated with our free analyses – sign up for our free gold newsletter now.
Thank you.
Sincerely,
Przemyslaw K. Radomski, CFA
Research mining stocks at the Investorideas.com free stock directory
https://www.investorideas.com/gold_stocks/stocks_list.asp
Check out the Exploring Mining podcast at Investorideas.com with host Cali Van Zant for the latest mining stock news and insightful interviews with top industry experts
Rick Rule: Dollar Could Lose 75% Purchasing Power, & What He’s Buying Now
Disclaimer/Disclosure: Our site does not make recommendations for purchases or sale of stocks, services or products. Nothing on our sites should be construed as an offer or solicitation to buy or sell products or securities. All investing involves risk and possible losses. This site is currently compensated for news publication and distribution, social media and marketing, content creation and more. Disclosure is posted for each compensated news release, content published/created if required but otherwise the news was not compensated for and was published for the sole interest of our readers and followers. Contact management and IR of each company directly regarding specific questions.
More disclaimer and disclosure info: https://www.investorideas.com/about/disclaimer.asp
Global investors must adhere to regulations of each country. Please read Investorideas.com privacy policy: https://www.investorideas.com/about/private_policy.asp